
Bitcoin Cash is trading below its immediate support level. The coin has been trading at the lower levels after dropping from its highs of $731. The coin has been moving below the down trend line; however, recently, it has begun to uplift, but there has been a slight recovery from the past 4-5 days. There was a formation of swing highs alone with the bearish candles, and the price couldn’t close above the swing high. If the coin hits the $372 mark, a bullish momentum can be expected.
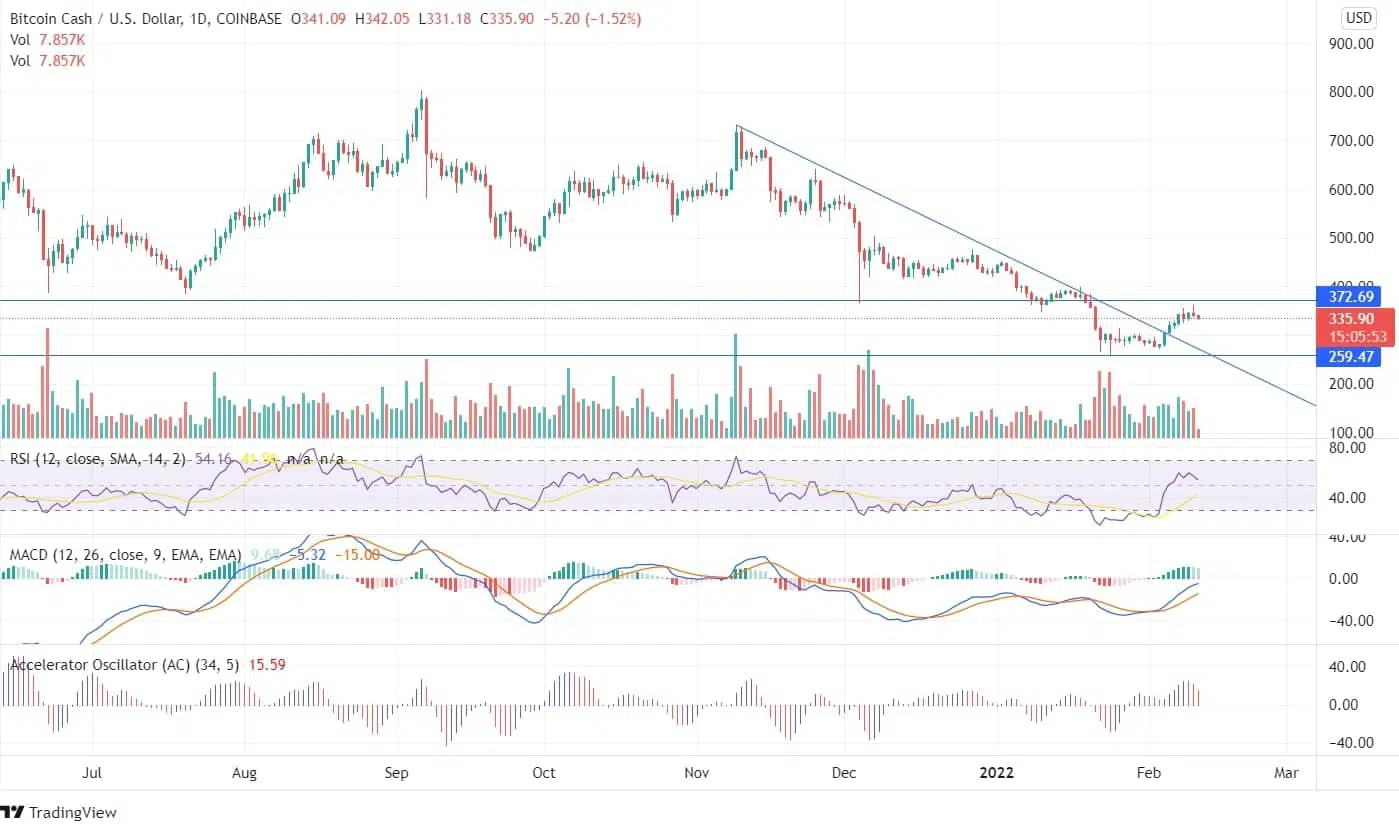
On the above chart, the MACD line is above the signal line, which can indicate bullish momentum. The RSI indicator is at 55, which is neutral. The volume candles also denote a neutral momentum, thus creating mixed signals regarding the price action. On February 10, the BCH coin price declined 7.8%. Based on Bitcoin Cash prediction, the coin might correct slightly before registering upside movement.
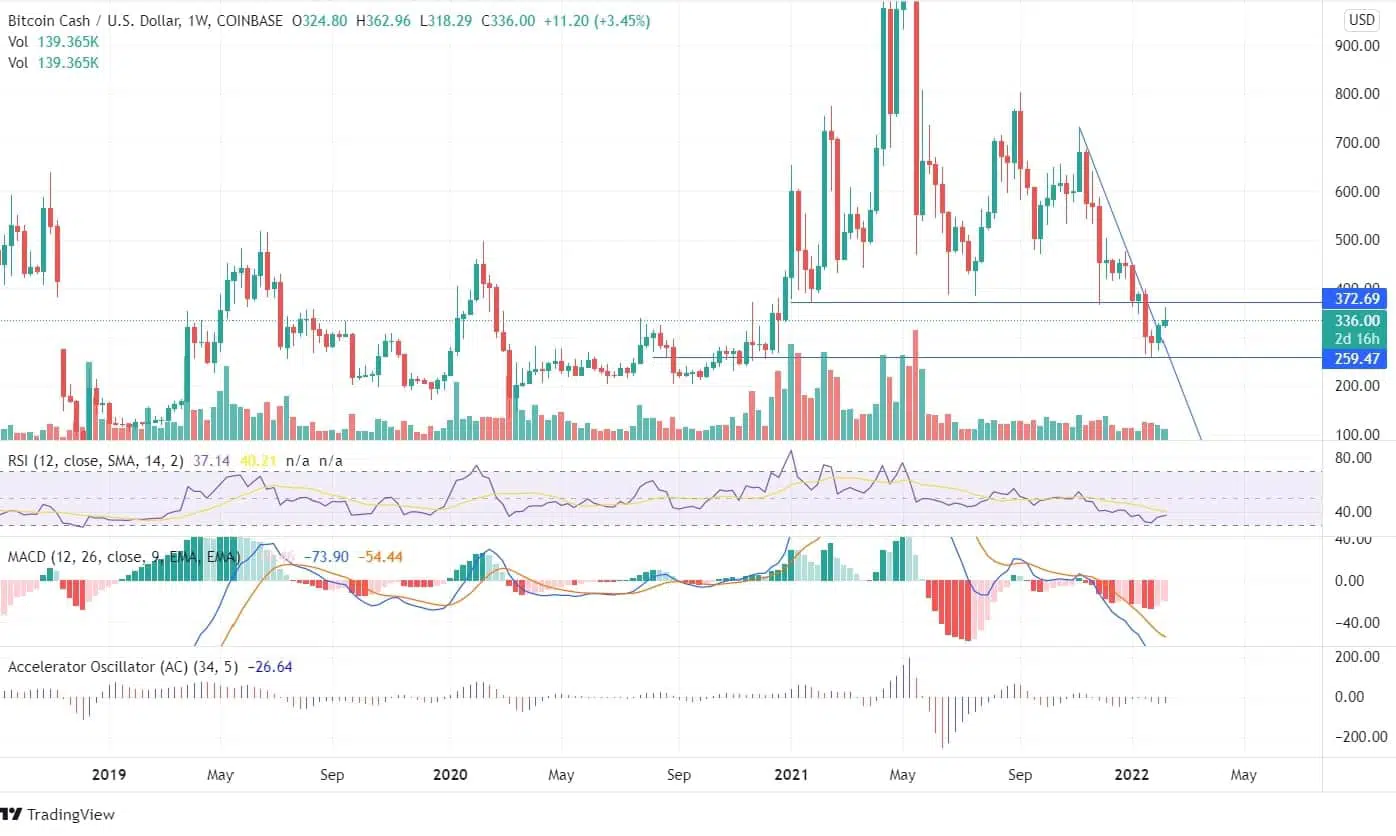
On the weekly time frame chart, the previous week’s candle has closed above the downtrend line, and the forming candle is moving upward. The price of Bitcoin Cash is still below its last support line and the technical parameters are in the bearish zone. A rise in the BCH coin price can be expected once the bullish candles continue to form and the price closes above the swing high of $398.92. The coin faced rejection from the bottom horizontal line at $259.47 in the weekly chart. The BCH price rising from this point can be an opportunity for investors and traders to take profit.
 Price Prediction 2024 – 2030")
 to touch $0.4, safest bet to take")
