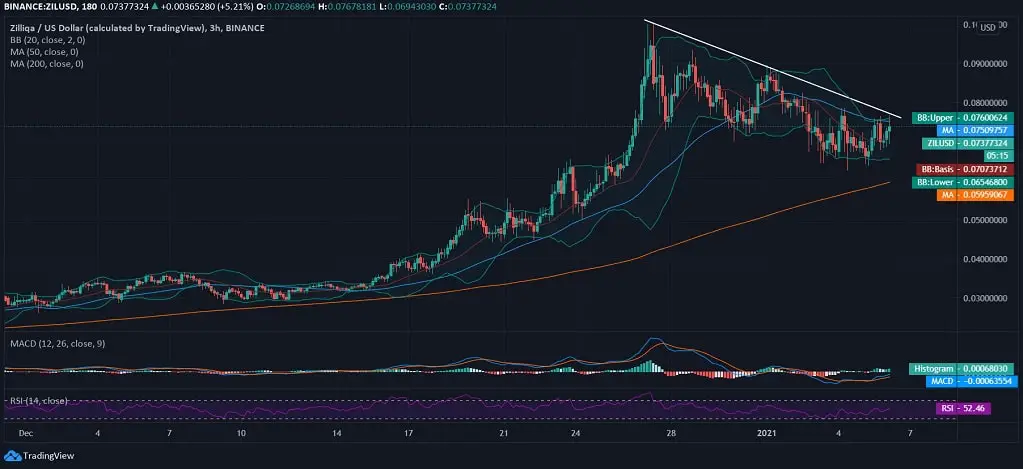
Zilliqa, after having traded amongst the top 50 cryptos, has made a commendable jump to now trade on the 40th position in the global crypto market with an augmented market capitalization against the increasing price of ZIL coin. Zilliqa, towards the end of the bygone year, enticed a major investor base after having breached a 30-month resistance. But due to lack of traction in the altcoin market, Zilliqa lost a major amount from $0.099 to $0.064, and within less than 8 days, it lost over 35%.
It is definitely Bitcoin’s time to pump through previous resistances, and many believe 2021 to be the year of Bitcoin and cryptocurrencies. In this respect, the largest cryptocurrency of the market has breached previous ATH, and here it is forming a fresh one above $36k. The sentiment remains clear, and as per the Zilliqa prediction, the coin might reflect considerable upside movements despite temporary pullbacks.
Just as the major cryptocurrency’s price magnifies, many altcoins have regained the lost traction, and therefore, the ZIL coin strengthens from $0.064 to $0.073. Although ZIL/USD clearly nosedived after hitting a 30-month high, it is no less than the market’s most lucrative and strongest cryptos.
Before tanking to monthly supports, ZIL breached major resistance and is back to drawing bullish candlesticks, reflects strengthening of 14% in less than seven days of the ongoing year.
Zilliqa Price Analysis
Zilliqa drops from the 30-month high and draws a clear downtrend but has spiked from the 10-day support below $0.065. However, the pullback range clearly coexists, and a clear breach of this downtrend is important for an intraday bullish crossover.
The MACD chart shows the real-time gain and, therefore, draws a bullish divergence after the ZIL coin crossed above $0.070, and the RSI of the coin is also seen rising from the oversold region to currently lying at 52.46, after the initial day’s price crash.
This shows that the demand for Zilliqa is reamplified after having lost complete traction, but a steady price spike is still required and retains 200-day MA support at $0.059 while has lost 50-day MA after losing momentum to trade above $0.075.
However, if we emphasize the 24-hour price movement of ZIL/USD, the bearish crossover remains as the coin fails to have a steep recovery, but the intraday is drawing a positive sentiment. The 20-day Bollinger Bands on the above chart are seen widening, and therefore, a volatile movement on the upper side is predicted.
The RSI on both the charts shows reasonable demand for ZIL, as, on the 24-hour chart, it lies at 59.82.

