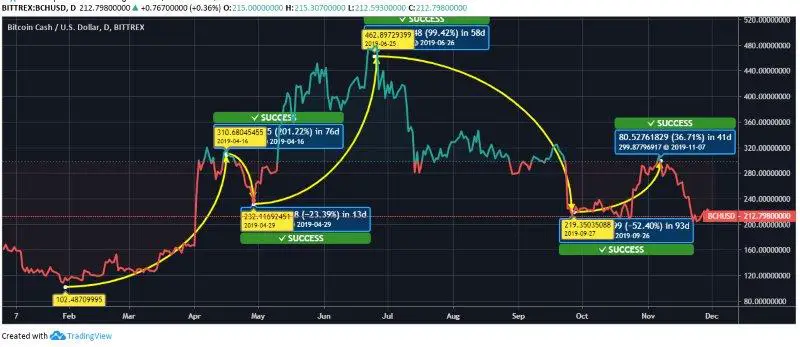
- Bitcoin Cash price continues to be under the influence of bears as observed from the YTD price trend
BCH price had a slow beginning to the year, but it managed to pick up upward momentum from April onwards till June. This was a great phase for the coin, but with the onset of the bearish phase, the price started sliding on a continual basis reaching below the baseline. The YTD price trend for Bitcoin Cash has shown the price movements between the range of $102 – $462.
Bitcoin Cash Price Prediction
The YTD price chart shows BCH price going with the speculative nature of the crypto market with moments of high and low-price momentum. The price was at a low of $102.48 on February 01. Though the year began on a low note, the price of Bitcoin Cash picked up and reached a high of $310.68 on April 16, showing a massive jump of 201.22%. There was a slight downward movement of $232.11 on April 24. Then the coin continued its upward journey and rallied to a good $462.89. The bearish pressure of July saw the price of BCH on a continuous tumble. It went below the baseline and stood at $219.35 on September 26, showing a downfall of a staggering 52.40%. There was some respite from the bear pressure when the price of Bitcoin Cash reached a high of $299.87 on November 07. Owing to the bear pressure, the current day’s BCH price has again gone down to $212.79.
Till July, Bitcoin Cash had managed to have a good run. Analysts are confident that the BCH coin can get back to upward momentum shortly. Investors should keep holding on to their current investments as the crypto market is expected to get stable by early 2020.

