News")
This post is archived. The content reflects information available at the time of publication and may no longer be relevant.
Dogecoin, one of the top 50 cryptocurrencies of the market, is seen trading at $0.00329 after a candlewick rejection and is now seen breaching the lower 20-day Bollinger Band on the daily chart. The current bearish pullback is due to price correction from the higher low marked at $0.00467 to currently trading below $0.0035, losing around 30%. One of the market’s top cryptos is seen drawing an inverse V-shape curve, as the price grew from the bottom of $0.0022 to rising as high as $0.0046 and currently trading below $0.0035 at $0.0032.
Dogecoin has slipped to a lower position compared to previous year’s ranking wherein it was one of the top 30 cryptos of the market, while this year, it is nothing less than a flattish trend with intermittent spikes.
Dogecoin Price Analysis
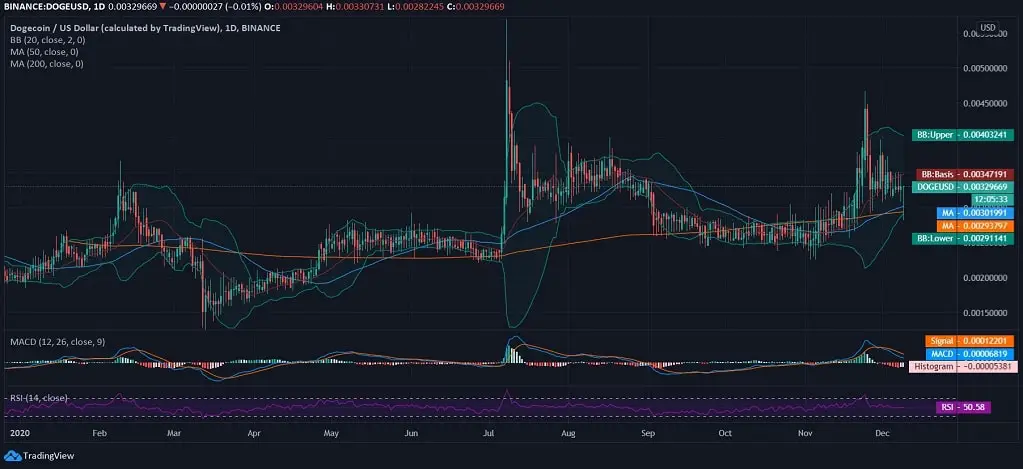
Today, Dogecoin was sotted at $0.0032 after a bearish pullback against the US Dollar. The bearish candlewick is seen breaching the lower Bollinger Band and is close to testing 50-day and 200-day MA support at $0.0030 and $0.0029 on the daily chart. The Bollinger Bands are reflecting no extremities as per the current trend of DOGE against the US Dollar. And as per the Dogecoin price prediction, the currency might end this year on a flattish note.
However, when the DOGE price pulled back to the extent of breaching the lower 20-day Bollinger Band, it tested all the supports below $0.0030. the MACD indicator reflects a clear bearish crossover due to price slash leading to diminishing demand. The RSI is away from hitting extremities at present, lies at 50.58.