What To Know
- Rising wedge signals a possible Solana drop to $160 support.
- Net inflows decline sharply, hinting at complex market dynamics.
- Mixed signals urge caution as Solana faces heightened volatility.
The crypto market momentum has slowed down in the recent days as none of the top cryptos showed major price movements. Solana (SOL) was also one of them, as its price only registered a modest 0/31% price decline over the last seven days. Through the recent volatility remains less, things can take a U-turn soon, as predicted by a popular crypto analyst.
Will Bears Take Control of Solana’s Price?
Ali Martinez, a widely followed crypto analyst, recently highlighted a concerning technical formation on Solana’s (SOL) chart—a rising wedge pattern, which is often considered a bearish indicator.
A rising wedge forms when prices move higher while the support and resistance lines converge, signaling weakening momentum despite upward price action. This typically results in a breakdown to the downside once buyers lose steam. Martinez pointed out that Solana’s wedge pattern could potentially drag its price down to $160, a key support level to watch.
Such a forecast carries weight because Solana has remained among the top-performing altcoins in 2025, with its upward price sentiment supported by advances in DeFi, NFT, and scalable blockchain solutions. But chart patterns like these remind traders that even the very strongest fundamental projects can suffer short-term price corrections. A breach of the wedge by Solana could further fuel bearish sentiment into liquidations, cascading down into sell pressure, not to mention the amount of leverage prevalent in the altcoin market.
On the contrary, if the bulls defend key supports and invalidate the wedge, Solana may resume its upward momentum. From Martinez’s point of view, however, it appears that one should be cautious, as Solana may be on the verge of entering into a volatile phase.
This Looks Promising Though
In Solana’s chart, a rising wedge caused alarm for a technical break and a drop toward $160, while on-chain data painted a more subtle picture. According to an analysis done by CryptoMoonPress from DeFiLlama’s data, Solana’s net inflows have decreased sharply over the last few days. Specifically, the figure for inflows nosedived from the $26 million mark on 1 September 2025 to barely $890,000 by 7 September 2025. On the face of it, this signifies something positive.
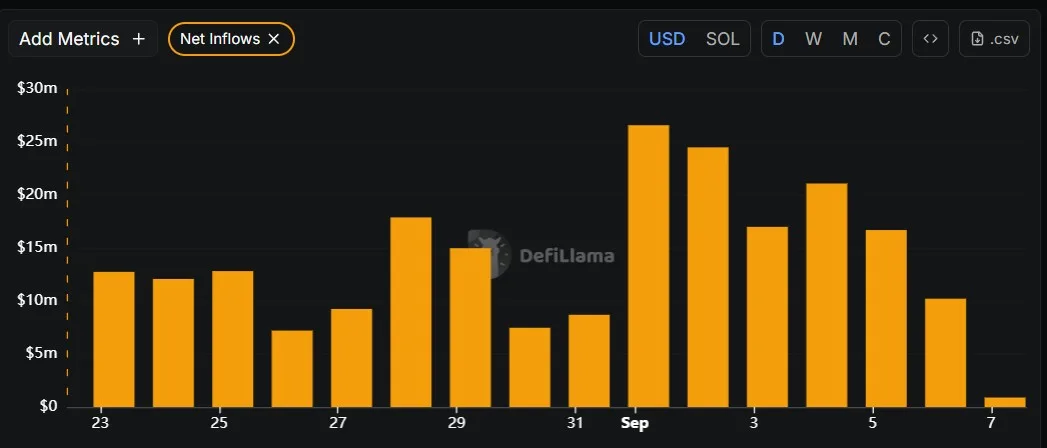
This dynamic might actually help prices in the short term. If inflows diminish, but overall liquidity remains steady, this could be an indicator of early entrants taking profits while new clusters of holders exhibit conviction and therefore do not exit the market in heavy numbers.
Meanwhile, for Solana, one might argue that this drop equally implies a potential halt in new entries by the giant players, such as large investors or institutions, creating room for a market-led price adjustment.
Therefore, while the technical wedge suggests caution, the inflow data highlights the importance of considering multiple metrics before predicting Solana’s next move.
Final Words
In conclusion, a near-term outlook for Solana is at contrasting perspectives between technical and on-chain signals. The pattern of rising wedges warns of a swift correction to $160, something that very well might fuel the bearish momentum if support breaks.
On the other hand, the reduction in net inflows brings up a more complicated market structure, where reducing new capital inflows do not ever mean disaster but indicate healthy profit-taking and market rebalancing. Investors must tread cautiously and keep their eyes on key support levels, integrating both technical and fundamental indicators before making their moves, since Solana’s next movement might focus its trajectory.