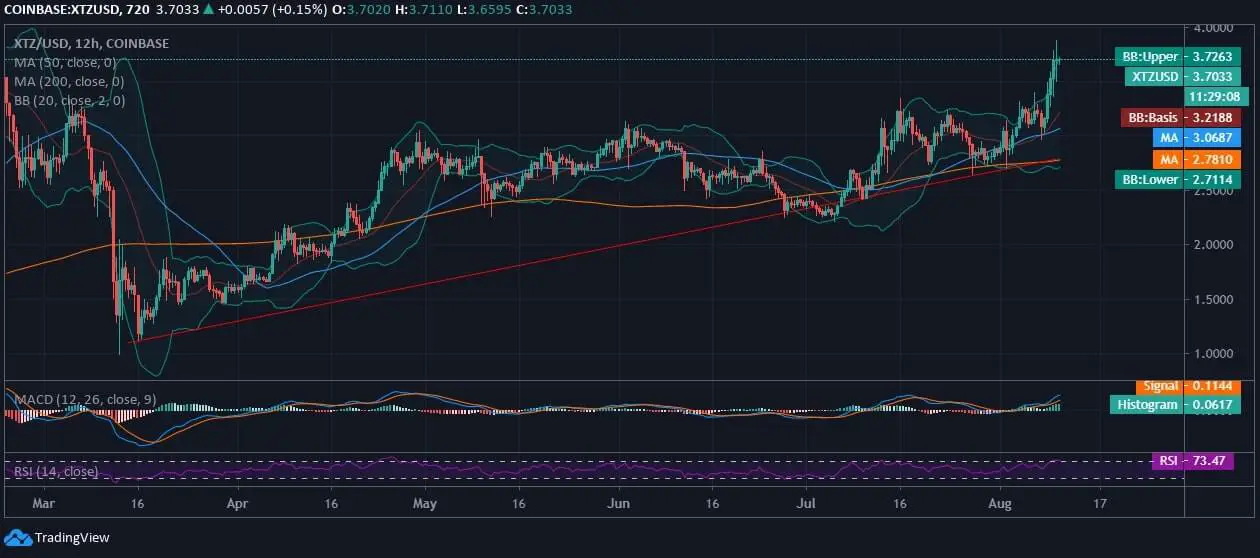
Tezos, at the press time, was trading at $3.70 and exhibited a complete bullish crossover and a steep surge from trading around $3.05. XTZ’s All-time High is marked above $4 and essential to note that the coin is facing strong resistance at $3.9 since the onset of the year when it went as high as $3.9 in Feb 202.
However, during the market crash in March, Tezos tested supports as low as $0.98 but has now strengthened by over 280% in 5 months as it reclaimed a 5-month high at $3.8 just yesterday. The currency continued to trade laterally unless it regained the lost momentum and proved its worth of being one amongst the top 15 cryptos of the market.
Tezos Price Analysis
Tezos, at the time of penning down this analysis, was holding active support from SMA50 & SMA200 at $3.06 & $2.78, respectively. XTZ is quite a volatile crypto, and we have drawn a fine uptrend right after March’s massive sell-off. The price trend of XTZ/USD is already hitting the upper 20-day BB with the recent steep bullish candlewick.
It was just yesterday when Bitcoin had reclaimed its trading position above 12k briefly but is back to trading below $12k around $11.9k. In this regard, many altcoins have spurred and exhibited steep recoveries from the intraday narrow trading range.
The MACD chart of Tezos is exhibiting a bullish divergence due to recent intraday surge. Similarly, the RSI is lying at 73.47. The major support and resistance to watch out for lies at $3.0 and $3.9, followed by $4.


