This post is archived. The content reflects information available at the time of publication and may no longer be relevant.
At the beginning of the ongoing year, the price of Ethereum Classic was trading around $4.5. The further days embarked on an exceptional hike in the price. In February, the ETC price crossed the $12.5 mark. However, it couldn’t manage to stay at this price point and started correcting down with a tremendous pace and fell to $3.10. Later, the currency regained its momentum and marked moderate recovery.
ETC Price Analysis
If we look at the price movement of ETC/USD over the last 90 days, the coin was trading around $6.24 on May 11. Within a week’s time, the price escalated to $6.95, but it was soon caught by the bearish pressure and the price dropped to $6. There was an immediate improvement marked which took the price of Ethereum Classic to $7.50.
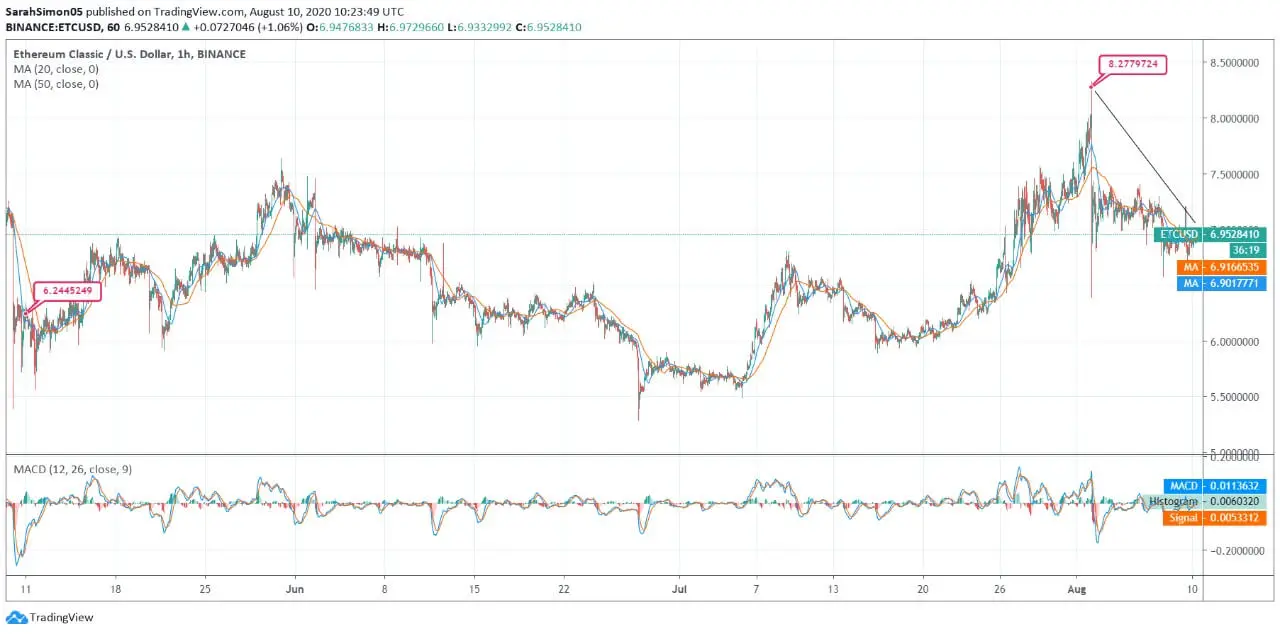
In the next month, the ETC/USD has continued to trade bearishly and experienced sharp pullback pressure in the last week. The currency fell to the lowest point of the month below $5.5.
In July, Ethereum Classic started trading with a stagnant movement. Till the end of the first week, the price hovered around the same level. Later, the price escalated to $6.90 on July 09. The ETC coin couldn’t hold for long at this level and fell to $6.00. Later, the currency escalated to $7.50.
From the beginning of the ongoing month, Ethereum Classic kept the downtrend intact after hitting $8.2, which has reshuffled the 90-days high and re-set at $8.2. Later, the coin faced steep fall and touched $6.95 at the press time with strong support from both the SMA lines.
The simple moving averages of 20 & 50 days are at $6.91 and $6.90 respectively. The lines are forming bullish crossover. The MACD chart reflects bullish crossover. As per the mixed signals, the impending period might record sluggishness.