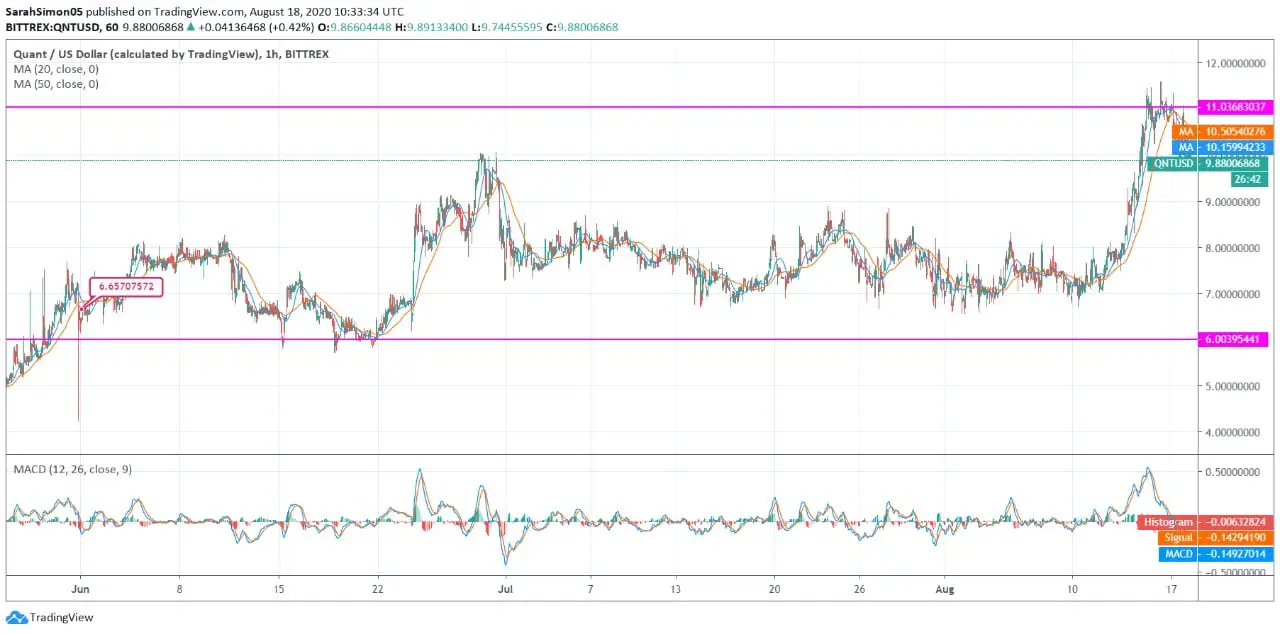
Quant price movement has been progressive throughout the year. The opening period of 2020 spotted the currency around $3.6, and now it is at $9.88. The escalation is almost three times. Over the last three months, QNT marked a similar momentum but with considerable volatile movement in between. And as per the current momentum, the coin might face a flattish trend shortly.
The overall price movement in Quant against US Dollar is reflecting uptrend. Starting from June 2020, the price spotted at $6.657 in the first week. The immediate days reflected steady hike, and the QNT price touched $8 mark. Then, after a moderate plunge, the coin fell to its crucial support level at $6. However, the later days reflected significant recovery, and the price escalated to $9.88.
In July 2020, the Quant price movement reflected range-bound trading around $8 & $7 for the entire month. From the beginning of the ongoing month, QNT price hovered around $7 till August 10. Then, the price escalated immediately after the same and crossed the immediate resistance level around $11.
Later, Quant faced rejection and started trading downwards. The price fell to $9.88 at the press time without having the support of daily SMA lines.
The MACD chart is reflecting bearish crossover. The technicals are reflecting towards the upcoming moderate momentum. QNT might trade flatly around the current price level for the short-term.

