- BRETT holds key support, eyeing $0.09 if momentum continues.
- Whales accumulate aggressively, pushing Buy Volume to near 100.
- Symmetrical triangle breakout could spark next bullish rally.
The cyclic crypto market has once again put top meme coins like Dogecoin (DOGE) and Shiba Inu (SHIB) in the backseat as their prices continue to fall. BRETT wasn’t an exception, as the meme coin’s value plummeted by over 4% last week. Things got worse in the past 24 hours as the token witnessed more than a 6% price decline.
After the latest drop, BRETT was trading at $0.05389 with a market capitalization of over $534 million. However, if the meme coin manages to hold on to one support range, then it won’t be a long shot to expect BRETT to launch towards $0.09 in the coming days or weeks.
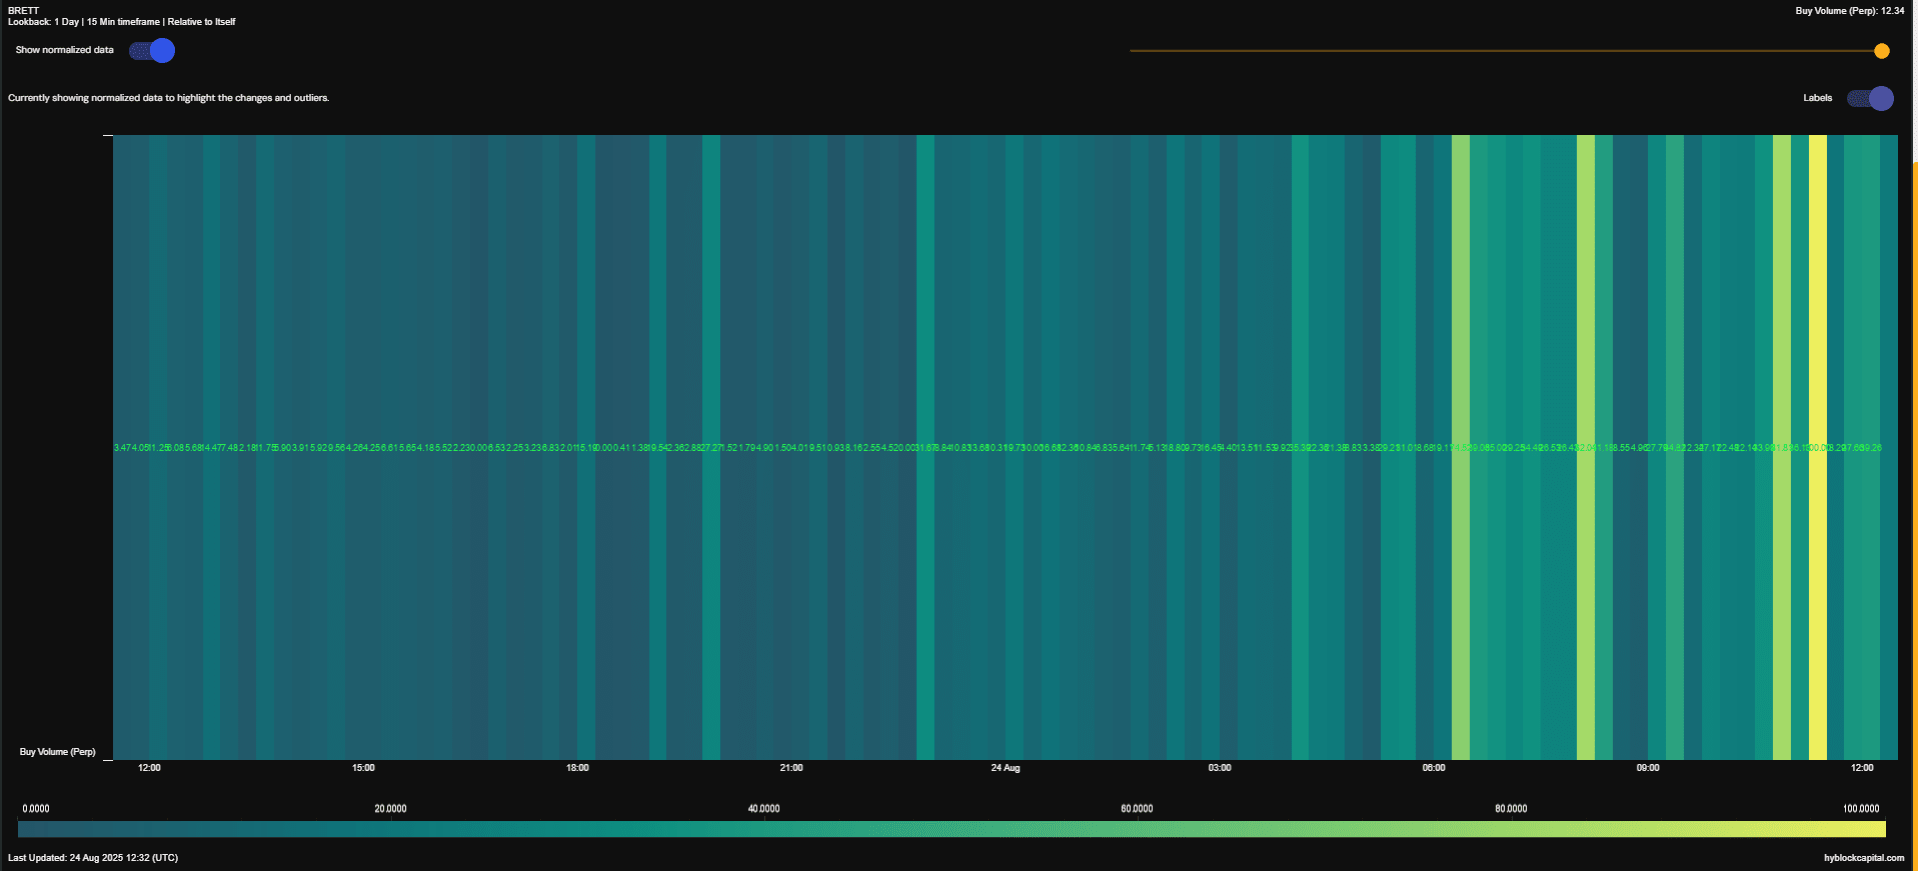
What analysts predict about BRETT
More Crypto Online, a popular X handle that posts updates related to various cryptos, recently posted a tweet regarding BRETT. As per the tweet, the meme coin is holding support in the $0.038–$0.051 area. If price can push above 0.067, the next target zone comes in around $0.093, with bigger upside potential toward $0.179–$0.218. Notably, strong resistance sits around $0.21–$0.22 from previous swing lows. A drop below 0.038, however, would weaken the bullish outlook.
Adding credibility to the bullish scenario is the data coming from Hyblock Capital highlighting a drastic shift in the market behavioral profile. Based on its metrics, investors have been heavy accumulators of BRETT during this rally. This was very well reflected in the token’s Buy Volume number, which spiked to 100 on 24 August.
Buy Volume runs normally from a scale where numbers nearer to 100 stand for buyers, and near 0 signals sellers’ pressure.
In the case of BRETT, this near-100 figure is a strong indicator of rising demand with aggressive accumulation by market operators. Whenever the number tilted with such a huge imbalance towards buyers in prior history, it has mostly resulted in further price appreciation, provided that other market forces remain favorable.
Forecasting BRETT’s next move
Since market conditions look favorable for BRETT, let’s delve deeper into the meme coin’s price chart to better understand where it can go next. The daily price chart showed that BRETT’s price was moving inside a parallel channel. However, a zoom out revealed the bigger picture.
A symmetrical triangle pattern has been shaping up for BRETT since April, indicating a phase of consolidation as the token moved within narrowing price ranges. This kind of pattern often reflects indecision in the market, where both buyers and sellers are waiting for a clear breakout direction.
At present, BRETT has reached the upper boundary of this symmetrical triangle, testing its resistance level. A decisive breakout above this zone could set the stage for a strong bullish move, with the token’s immediate target being $0.077. If momentum continues, BRETT could further climb toward higher levels, with $0.079 and $0.09 appearing as the next key upside targets.

On the flip side, it’s important to remember that the crypto market is inherently volatile and unpredictable. A failed breakout attempt or a shift in broader market sentiment could trigger a bearish reversal. In such a case, BRETT might retrace to its lower support zone around $0.035, erasing much of its recent gains.
Therefore, traders should keep a close eye on both market conditions and volume confirmation before taking positions. The coming days will likely be crucial in determining whether BRETT enters a bullish breakout or succumbs to downward pressure.