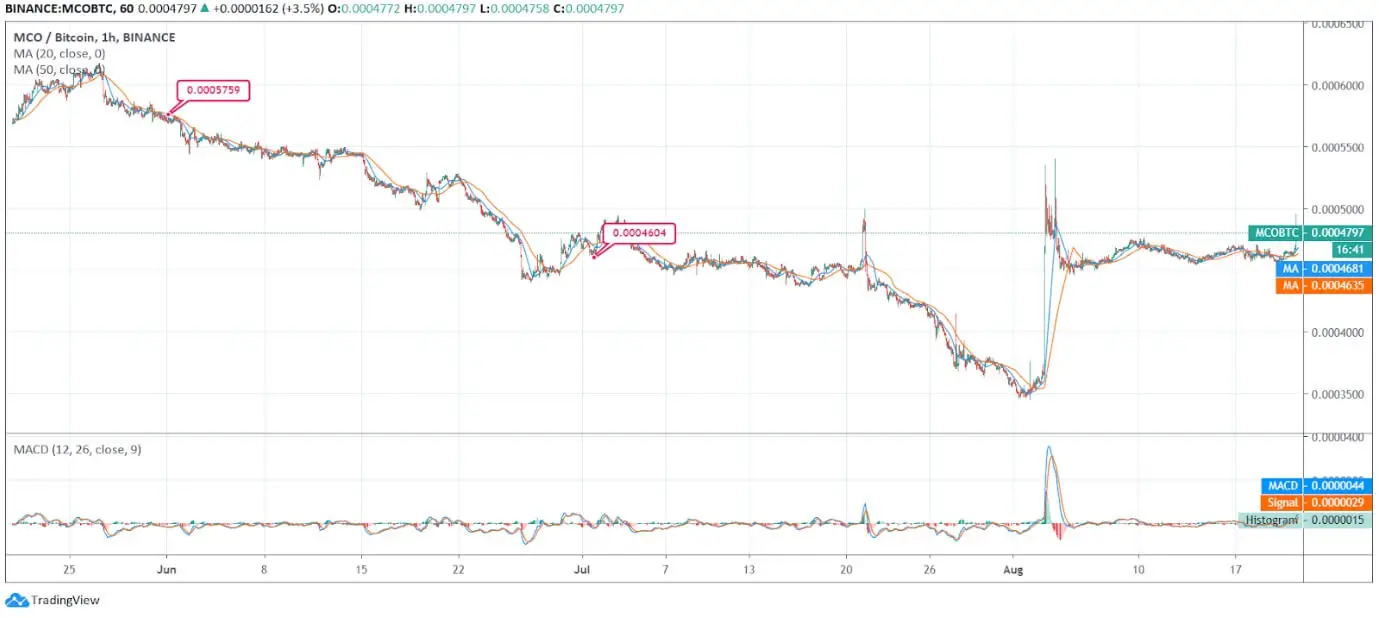
MCO token has been less affected from the market’s pressure or movement over the last few weeks. Where many coins are affected by Bitcoin price movement, MCO manages to keep it distinct. The below chart reflects a similar picture where we can spot plunge but later it marked improvement. The current market cap is at 7,551 BTC and 24-hour volume is at 1,468 BTC.
The price movement of MCO/BTC over the last three months reflects hefty volatility. In June’s first week, the price spotted around 0.0005759 BTC. The MCO token was trading under strong bearish influence. On June 15, the price was at 0.0005430 BTC. The fall continued till the end of the month with few spikes at 0.0005330 BTC and 0.0004797 BTC.
In July, the token marked a moderate momentum but recorded minor plunge which took the price at 0.0004604 BTC but later, it escalated to 0.0004797 BTC. Later, the currency dropped to 0.0004681 BTC and locked at the same price till July 21, 2020. With a spike at 0.00050 BTC, the MCO token took a heavy plunge to $0.0003500.
However, in the ongoing month, the currency regained the upward momentum and registered a steep hike which took the price at 0.0005400 BTC. Later, the MCO price returned to 0.00045 BTC and is pondering around the same level till now.
The daily moving averages of 20 days overlapped 50-days line The lines are reflecting bullish crossover The MACD is also reflecting bullish crossover and hence, we can expect that the coin might reflect recovery in the next couple of days.


