- Binance Chain reduces gas fees by 20x to 0.05 Gwei, boosting network speed.
- BNB price dips 5% despite lower fees, signaling strong profit-taking activity.
- On-chain data shows $51M outflows and $14M long liquidations within 24 hours.
BNB Chain has rolled out one of its biggest network improvements yet, slashing gas fees by twentyfold. The new base rate of 0.05 Gwei is now standard across the network, making transactions far cheaper for users and builders.
Even so, the market barely flinched. The altcoin’s price slipped 5% in the past 24 hours, holding close to its recent lows despite the upgrade. The network’s fundamentals, however, continue to strengthen in the background.
Ecosystem Quickly Shifts to Lower Fees
Top platforms such as Binance Wallet, Trust Wallet, and Aster DEX have already adjusted to the new rate. For developers, it means smaller costs when deploying contracts or testing apps. For users, it means faster, lighter transactions.
The lower fees come as part of a year-long effort to optimize gas usage. BNB Chain previously cut gas fees twice, first by 10x and again by 2x, finalizing this 20x reduction. Binance co-founder Changpeng “CZ” Zhao celebrated the achievement on X (formerly Twitter), saying, “Builders build.”
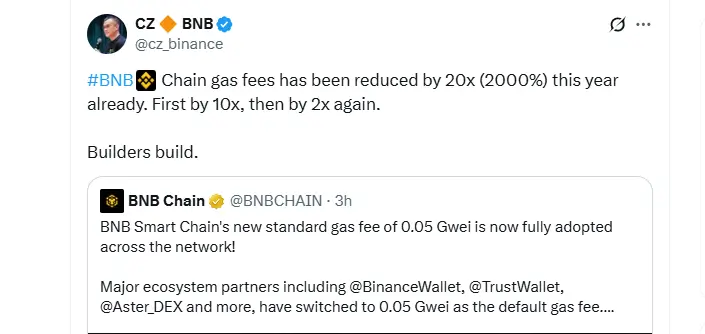
BNB Reduces Gas Fee by 20X (Source: X)
Despite the lower fees, BNB’s market cap dropped 5% to $174 billion, and daily volume fell 20% to about $8 billion. Analysts believe traders may be locking in profits after weeks of steady gains.
Still, momentum on the charts remains upbeat. BNB is up 19% this week and 42% this month, showing that investors expect the fee reductions to boost activity and liquidity on the network in the long run.
Cheaper, Faster, and Friendlier for Developers
At 0.05 Gwei, BNB Smart Chain is among the cheapest Layer-1 networks for DeFi, gaming, and token swaps. Developers can now run complex contracts without worrying about high fees, while users get smoother transactions. Such a move could attract new projects seeking affordable scalability.
Major networks such as Ethereum and Solana are also working to reduce user costs and improve throughput. However, BNB Chain’s latest move shows its intent to compete for the next wave of developers and on-chain applications, where speed and affordability matter most.
BNB Price Action: ATH Momentum Fades
Upon reaching its ATH around the $1,355 zone, the token’s price pulled back and consolidated within a distribution zone around the $1,327 to $1,265 range. However, the token broke below this range a few hours ago and is edging on a downward trend, currently at $1,238.
The volume bar chart reinforces the sell-side pressure building in BNB’s price action, as its red candles are expanding following the recent price dip. This validates what many traders refer to as a distribution zone, a type that forms when early buyers begin taking profits.
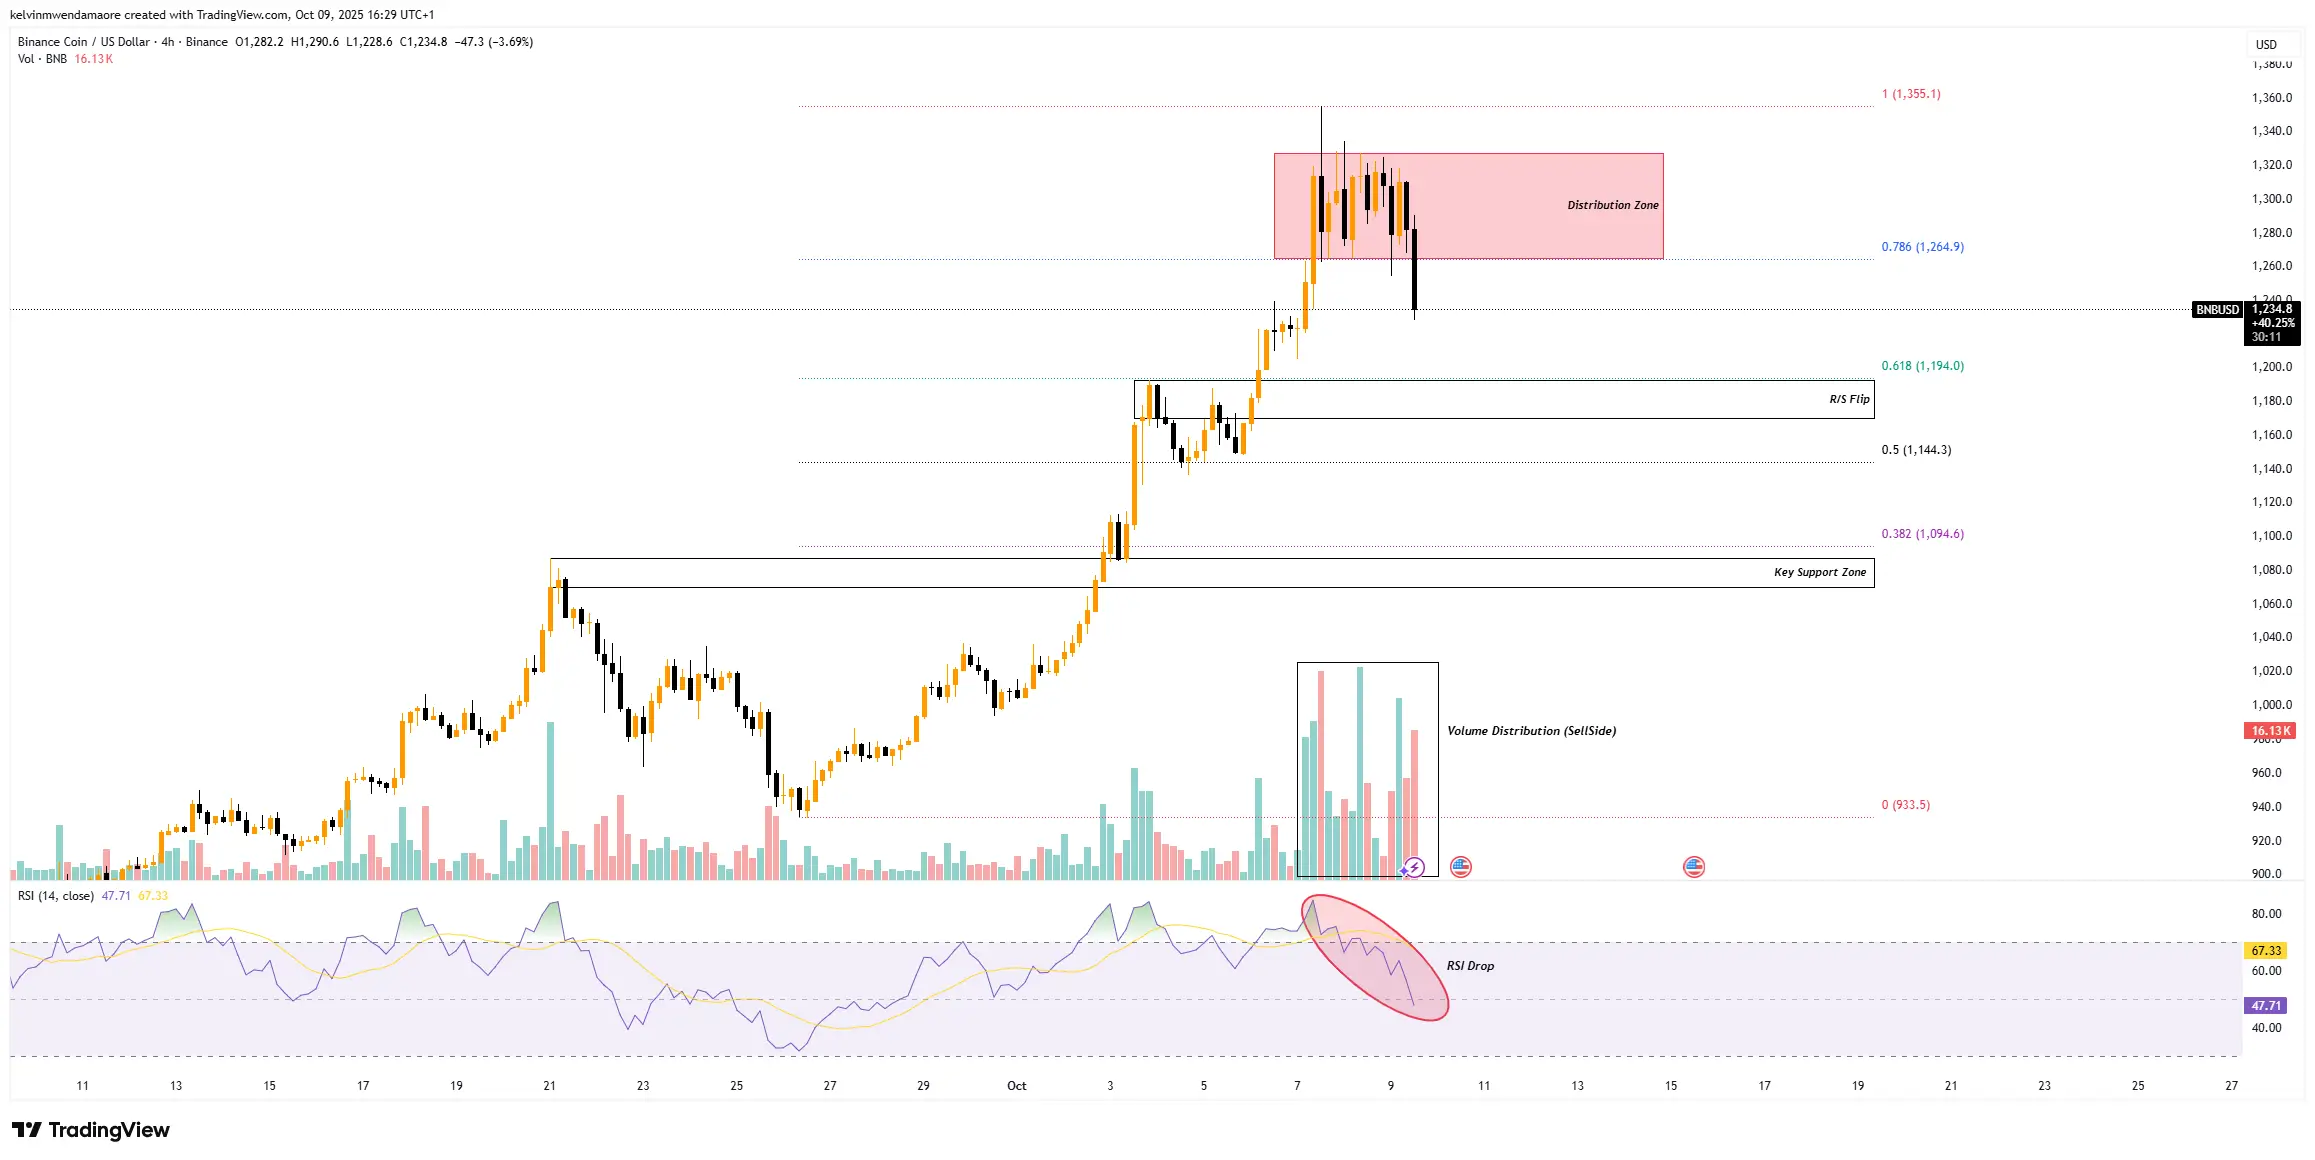
BNB Price Action (Source: TradingView)
Following this dip, the market’s focus has now shifted to the next levels that might catch the fall. Around $1,192 to $1,170 lies the first possible landing spot, right near the 61.8% Fibonacci mark. If that floor gives way, the chart points to the 50% Fib level at $1,144, followed by the $1,087 to $1,070 price range, which coincides with the 38.60% Fib region as the ultimate support levels.
A breach of this zone could confirm a sustained bearish sentiment, potentially pushing the token below the $1,000 mark. Momentum indicators point to a similar image. The RSI, for instance, has drifted down from overbought territory and now sits near 47.
This represents the middle ground, but one that edges to the downside. Should the RSI drop below 40, it would confirm more profound weakness, with ample space for a further price dip before hitting oversold conditions.
Traders Unwind Positions as Selling Cycle Intensifies
On-chain data backs this up. In just two days, roughly $51 million in BNB has left spot exchanges. The pattern is clear: traders are moving tokens out, likely locking in gains from the recent top.
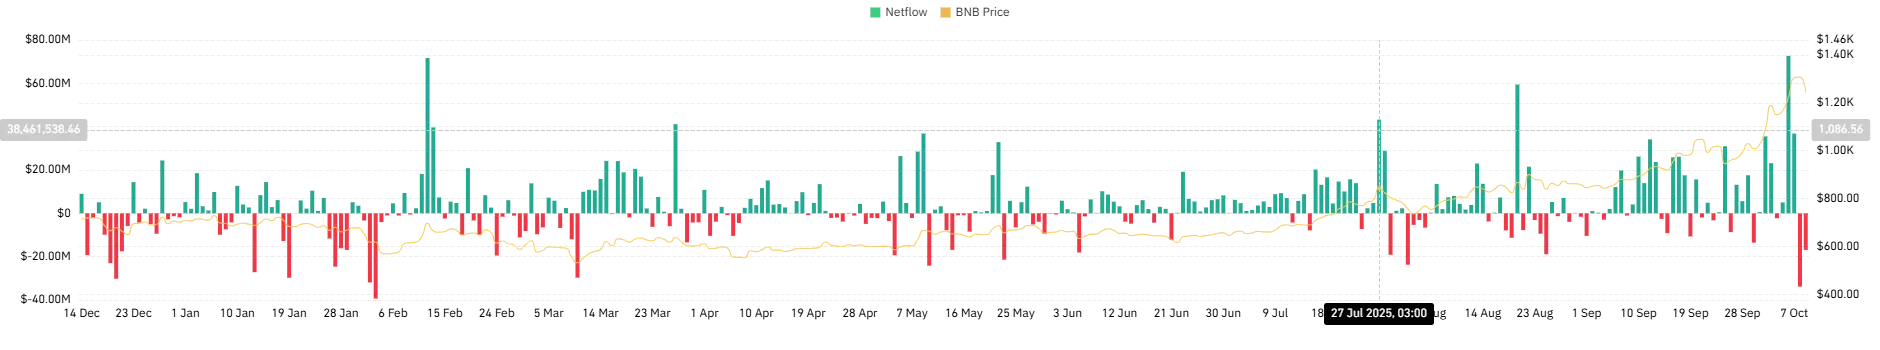
Spot Inflow/Outflow Chart (Source: CoinGlass)
Liquidation figures add another layer. In the past 24 hours, close to $14 million in long positions have been wiped out, compared with less than $2 million in short positions. That imbalance signals a long squeeze, as leveraged traders are forced to exit when prices slide.
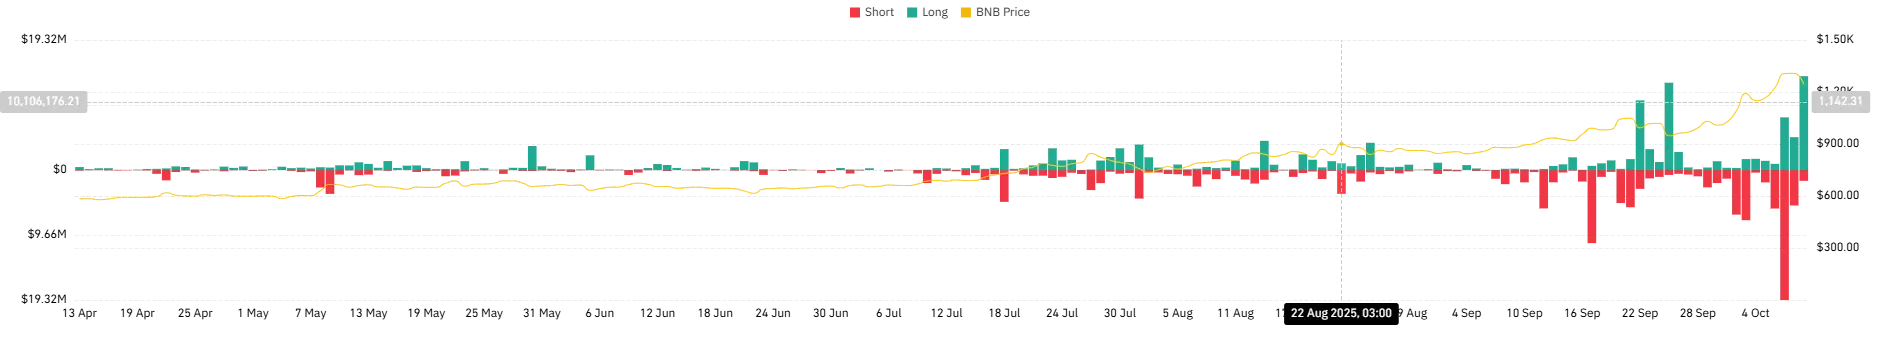
Total Liquidations Chart (Source: CoinGlass)
Each forced sale pushes the price lower as optimistic buyers attempt to cover their losses, fueling a cycle that can snowball until the market cools.