
Nexo price movement has been quite sluggish since the massive sell-off in March. If we look at the price movement of the past 3 months, the coin was trading around 0.000012 BTC at the beginning of May, and now the NEXO price is around 0.000022 BTC. Despite a massive plunge in the global economy in the last few months, the coin has managed to recover substantially. The investors are eager to book hefty profits as per the current price movement.
Nexo Price Analysis
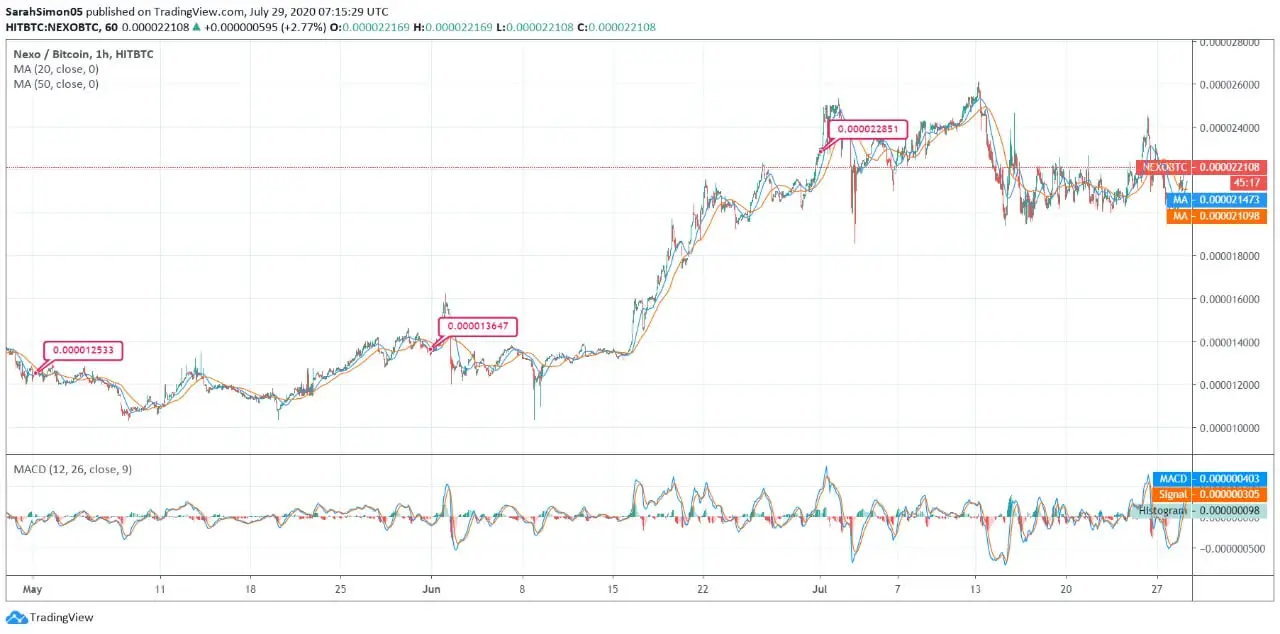
The above chart of NEXO/BTC is exhibiting a massive growth. In May, the coin was trading at 0.000012533 BTC, and it continued to trade with a moderate momentum till the next month. After mid-June, the Nexo token marked a sudden hike and started trading with a strong upside momentum.
In the last week of June, the currency escalated to 0.000022851 BTC. Later, the token reflected massive volatility since the beginning of the ongoing month. The first few days marked significant growth as the Nexo price escalated to 0.000026 BTC. However, after trading at this high, the currency faced steep fall and slipped to 0.000021098 BTC on July 15. The price has been still since then. Today, NEXO is again reflecting substantial improvement.
The daily moving averages of 20-days & 50-days are at 0.000021473 BTC & 0.000021098 BTC, and both the lines are forming bullish crossover. Also, at the press time, the NEXO token was trading with strong support from daily MAs.
As per the MACD chart, the MACD line has overlapped the signal line. The bullish crossover indicates positive momentum in the NEXO token. As per the technicals, the currency might continue trading upwards and retest 0.000026 BTC soon.


