 News")
The YTD movement in Quant is reflecting moderate escalation in the price, while the last month was quite volatile. The token broke the quarterly high. However, July started with a minor downward correction. The same is because of the market pressure, and the same might lift in some time. Currently, the QNT price seems to book a short-term gain.
Quant Price Analysis
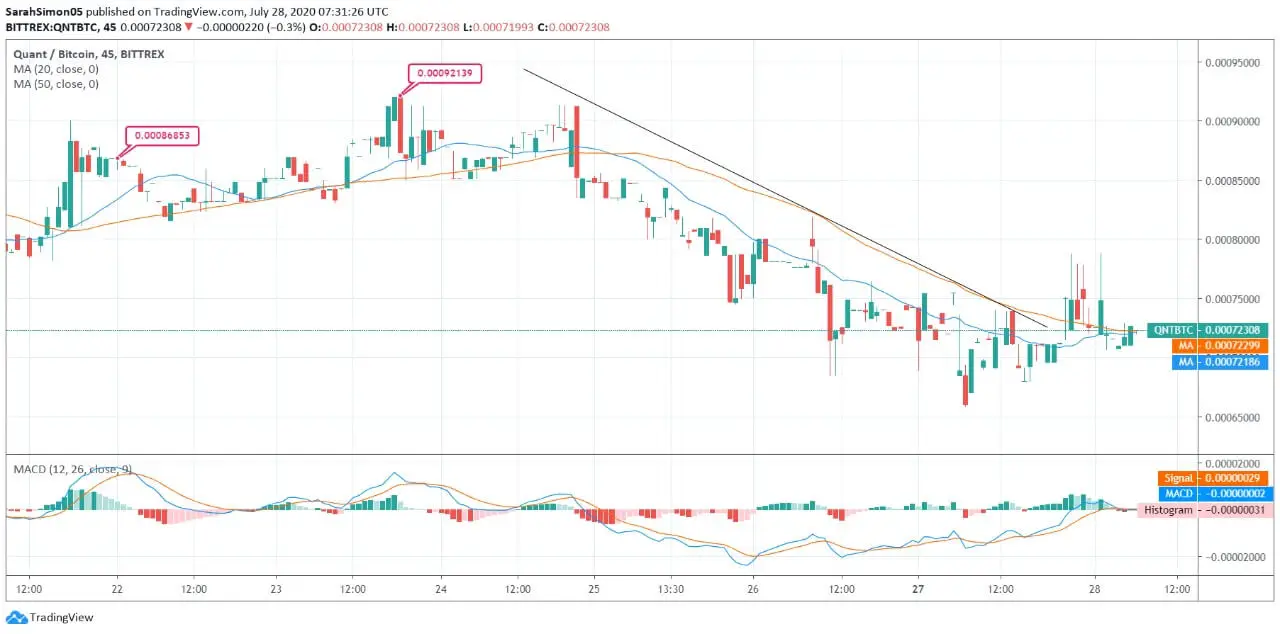
The weekly chart of Quant against the Bitcoin is reflecting a notable decline in the price. The token was spotted around 0.0008685 BTC on July 22. The escalation was spotted till the next day. The weekly high was breached at 0.000921 BTC. The price remained at the same level until the first half of July 25.
Later, the Quant felt pressure in the second half of the day that continued till yesterday. The trend line is exhibiting a steady, gradual decline in the price. Today, QNT price is reflecting stagnant movement. The chances of recovery are still ripe.
The MA50 & MA20 are at 0.000722299 BTC and 0.00072186 respectively. The averages are forming bearish crossover, and the current price of Quant is trading with strong support from the SMA lines. The mixed indications are pointing towards stagnant moves in the currency.
As per the MACD chart, the signal line has crossed over the MACD line and formed a bearish crossover. The indicator is favoring the sluggish movement of the QNT token.


