2020 started with huge anticipation and hopes. The sudden aggravation of the pandemic proved to be a setback. However, cryptocurrencies are spotted improving from the last couple of weeks. If we compare from the previous six months, then the improvement in July would be marked as most. The anticipation of improvement is still ripe. The indicators are pointing towards better days, and we are positive that it might happen soon.
REN Price Analysis
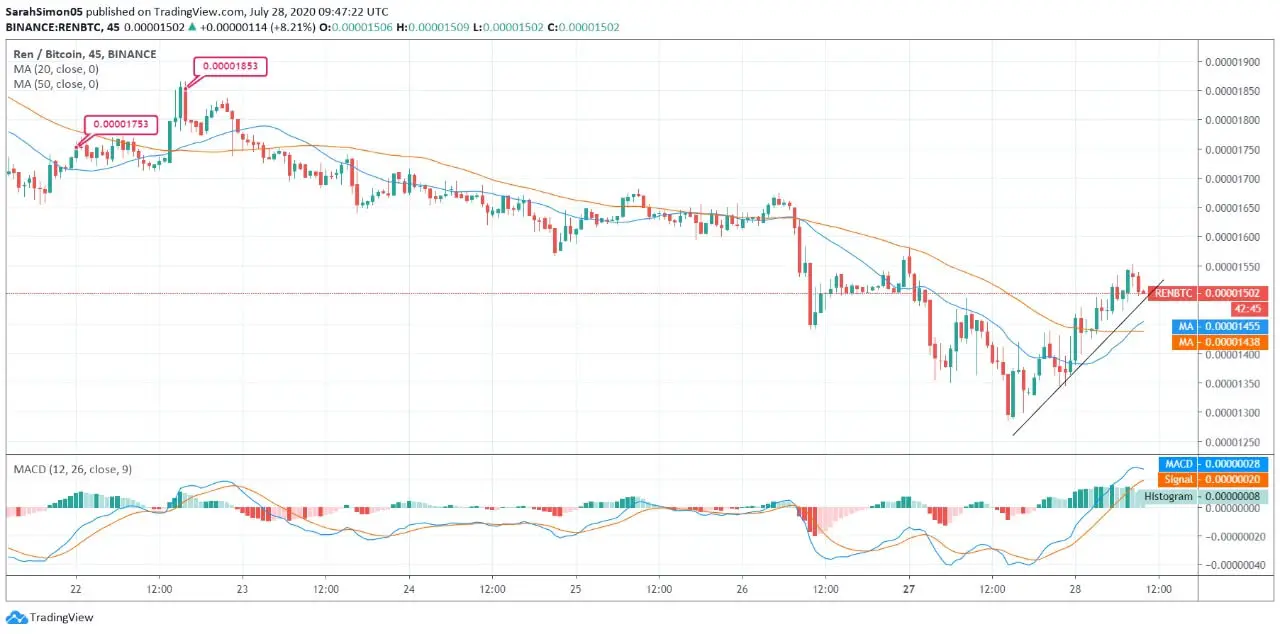
The week-long price movement of REN is reflecting hefty volatility. The currency was trading at 0.00001753 BTC on July 22. And on the same day, the coin touched a week’s highest price at 0.00001853 BTC. Thereafter, the movement in the REN price was stagnant yet felt a minor pressure. Later, the currency marked a heavy decline and fell below 0.000013 BTC.
However, after trading below 0.000013, REN regained momentum and registered a significant hike over the last 24 hours. The currency regained its price level above 0.000015.
The 20-day MA and 50-day MA are at 0.00001455 BTC and 0.00001438, respectively. The daily MA50 is below MA20 forming a bullish crossover. As per the MACD chart, the MACD has crossed over the Signal line. The indicator is pointing towards positive momentum.
The technical counters are currently reflecting a significant strength. The possibility of shifting towards the immediate resistance for REN is relatively higher than slipping to the immediate support level.


