
The crypto market has spotted a tremendous crash in March, but later, almost all the coins were spotted impressive recovery. However, after month-long escalation, most of the currencies are reflecting sudden decline.
Steem price chart given below is also influenced by the price crash. However, the month-long movement has kept the hopes of recovery. The current market cap is at $85,855,7850 and 24-hour volume is at $9,175,770.
Steem Price Analysis
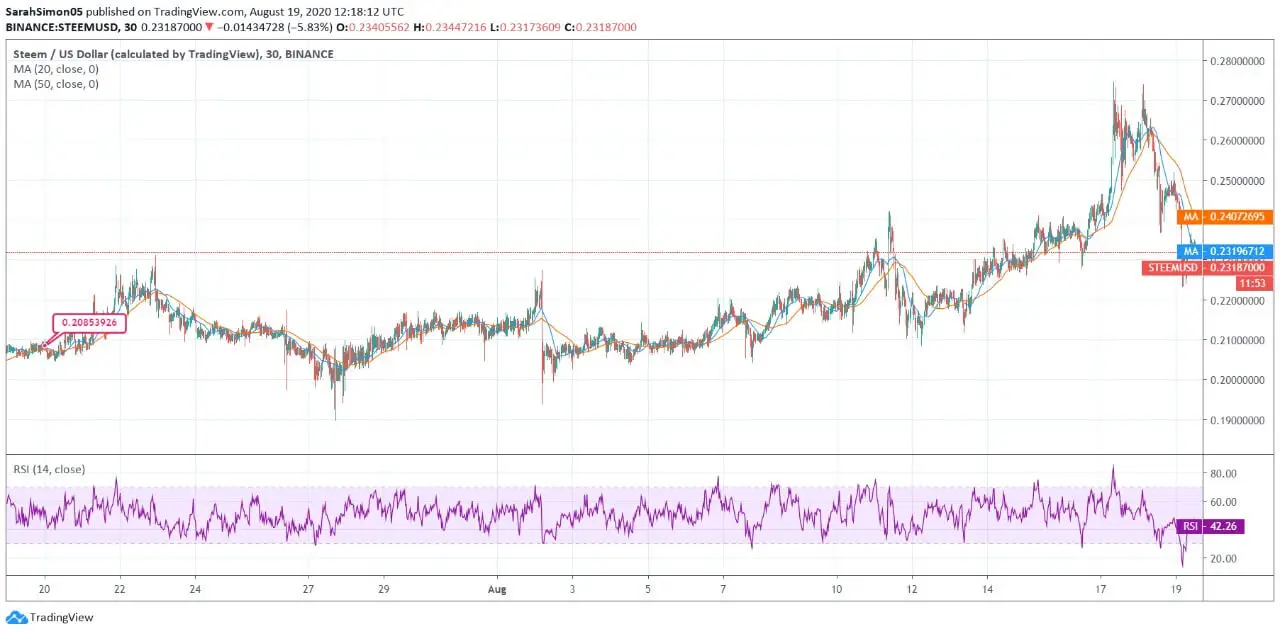
On July 20, the price of STEEM/USD was around $0.208, and it was trading with upside momentum. After two days, it breached $0.231, but the following days marked minor regression in the price that brought the coin to $0.20. However, the closing of the month reflected moderate improvement, which took the price to $0.213.
Since the beginning of August, Steem has locked itself around a $0.22 mark. On August 10, the currency marked an escalation that took the price to $0.24. Later, the coin faced sharp pullback and fell to $0.21, but again started escalating.
Over the last three days, Steem formed a double top around $0.27, but from yesterday, it faced a sharp decline, and today, it registered a massive price crash. The downtrend seems to stay for a while with the coin.
The SMA lines are forming bearish crossover, and the currency lacks the support of both the lines.
The RSI index is at 42.26. The technical indicators project stagnant movement for the short-term.


