What To Know
- PEPE forms a bullish symmetrical triangle, signaling a potential 78% breakout rally.
- Strong resistance ahead at $0.0000128, $0.0000139, $0.0000143, and $0.000015.
- Declining long/short ratio hints at short-term bearish sentiment despite momentum.
PEPE has been on a gaining spree over the last month as bulls refused to lose control to bears. This positive trend is still continuing as the meme coin is showing no sign of stopping in the near future. In fact, latest analysts suggests that the chances of PEPE showcasing a massive 78% price are high. Ergo, CryptoMoonPress dug deeper to find out what’s cooking in the market.
PEPE’s price is rising
The past month has witnessed PEPE surging steadily by 8%, while being nudged at a market cap close to $4.7 billion, attesting to its growing stature within the meme coin realm. Such optimistic bullish momentum has caught many analysts’ eyes, with prominent crypto analyst Ali Martinez pointing toward an intriguing technical formation on PEPE’s chart. Martinez stated that the meme coin has been coerced into a multi-month symmetrical triangle pattern, which usually spells out a strong price move is soon to follow.
$PEPE readies for a 78% price move! pic.twitter.com/z7zN3ZXe25
— Ali (@ali_charts) September 17, 2025
This particular pattern started to develop in December 2024 and now seems to be touching its final pitch-that is to say; a breakout seems to be in the offing. The breakout point lies close to where PEPE shall remain, fanning bullish hope among participants. Statistically, symmetrical triangles resolve in the direction of the current trend; meanwhile, that has been rather bullish for PEPE since the last quarter. Analysts speculate that if the breakout occurs as predicted, PEPE could likely rally in price by 78% to new highs and possibly consolidate its touted position as a top-performing meme coin of the year.
What are the possible targets?
According to CryptoMoonPress’ analysis, while the bullish setup for PEPE looks highly promising, the meme coin is still to overcome some big hurdles to really “skyrocket” by 78% and reclaim the December 2024 high. The technical indications do not really suggest an entirely smooth riding. According to the liquidation heatmap, PEPE encounters heavy resistance at $0.0000128, $0.0000139, $0.0000143, and $0.000015, respectively.
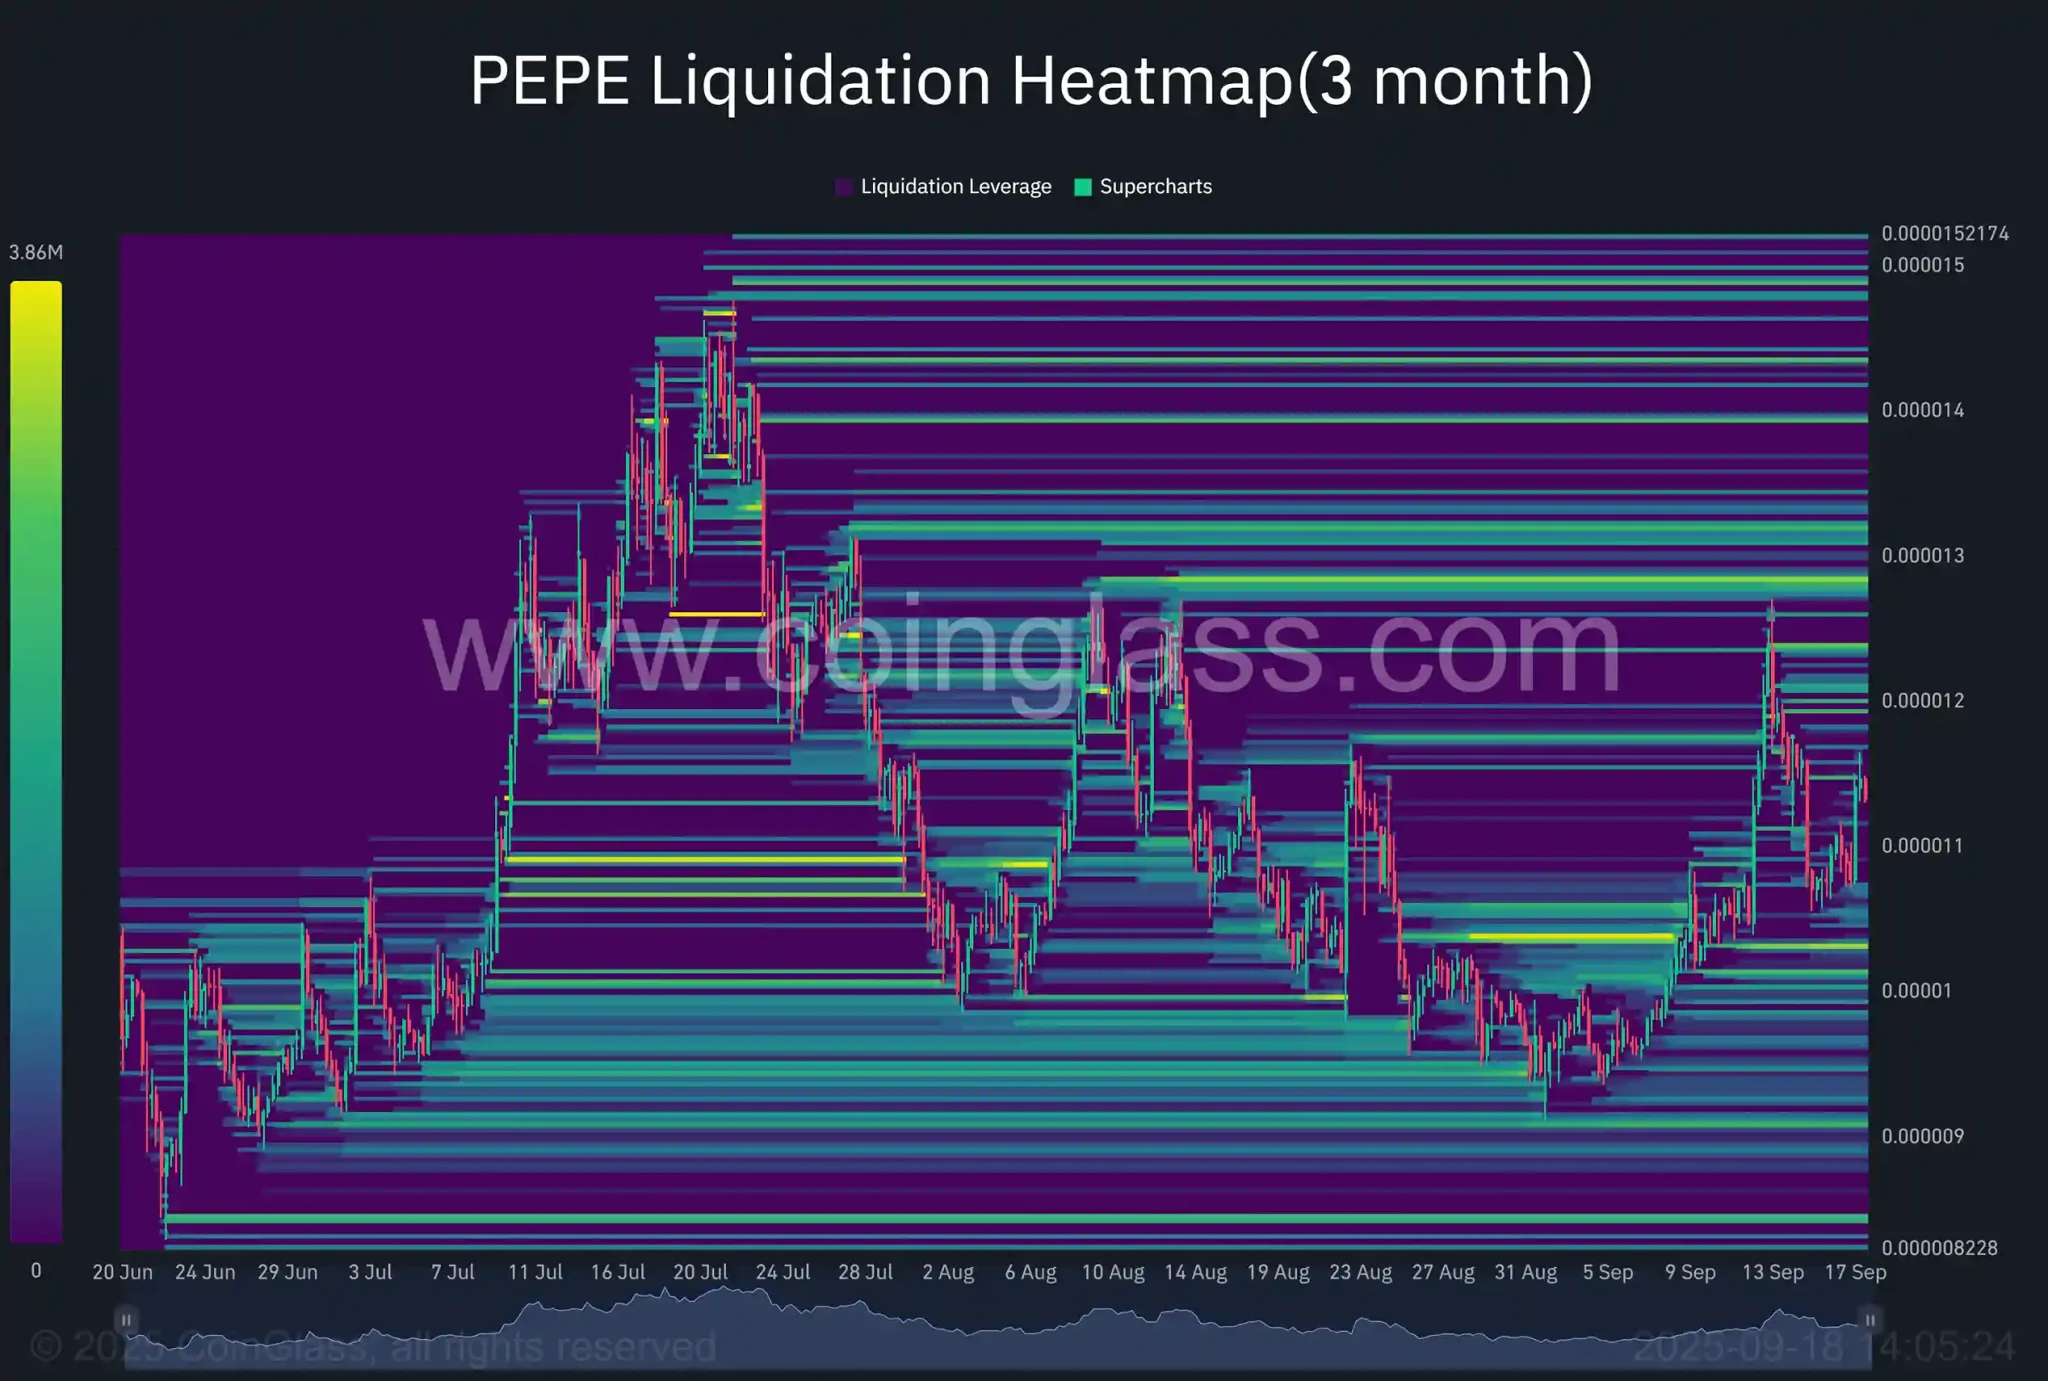
These areas are where many traders may panic-close their positions, thus making it even harder for PEPE to pass through without significant buying pressure. Now, if the coin can pass through any of these levels on the back of strong volume, then it might well pave the way for the sharp rally that the bullish 78% upside model is predicting.
While some say that the short term looks all green, a concern that one might raise comes from the long/short ratio lately having seen a decline. To explain, this ratio is basically the measure of how many active long positions there are against short positions in the market. A decrease in the long/short ratio points to traders slowly closing long bets and instead favoring short ones. This signals increased caution among market participants, who begin to lean toward bearishness in the near term. Were that trend to continue, a price pullback might probably happen from time to time before any real breakout.
In Conclusion
PEPE is standing at a critical juncture where bullish momentum and technical patterns suggest a potential 78% move. Although a strong zone of resistance and falling long/short ratio would lead to small pullbacks, the wider trend remains encouraging to long-term holders.
Should PEPE surmount key barriers on good volume, it would then have every chance of reclaiming its December 2024 high and positioning itself firmly among the darling meme coins of the year: nevertheless, investors cannot let their guard down in the extreme near-term volatility.