
- Stellar continues to be affected by the bear momentum in the crypto market as seen from the YTD price chart
Stellar (XLM) price began the year on a good note and kept going with the upward momentum till the end of June. When the bears entered the crypto market space, the price of XLM started being under pressure and was inclined to the lower range. The YTD price chart indicates a price swing in the range of $0.06–$0.13.
Stellar Price Analysis:
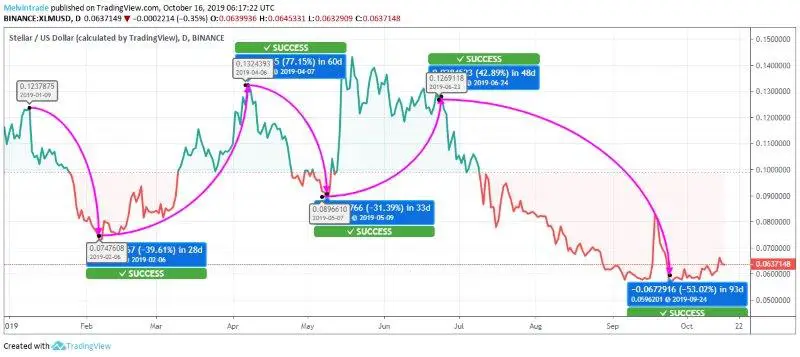
XLM had managed to keep the price movement in the upward range for most part of the year till the time volatility set into the crypto market as observed from the YTD price chart. The price was at a high of $0.1238 on Jan 9. From there the price went below the baseline at $0.0747 on Feb 6, marking a downward swing of 39.61%. By then the bulls had set in the market and the price started an upward journey by a massive 77.15% and reached $0.1324 on Apr 7.
There was a slowdown in the crypto market and the price went down to $0.0900 on May 9, by 31.39%. By the end of next month, the market then recovered to the extent of 42.89% at $0.1269 on June 24. The crypto market then went into a bearish zone and from here it was a continual downward swing for XLM, and the price went down to $0.0596 on Sep 24, the downward swing was to the tune of a good 53.02%. The current trading price is $0.0637 which shows a slight upward movement to the extent of 6.88%.
Stellar had managed to put up a good run till the bearish sentiment hit the crypto market. Analysts expect the current bearish trend to continue for the short-term but are hopeful of a bullish sentiment by the end of the year for XLM. Investors should not get panicky and continue holding their investments till the crypto market volatility subsidies. Day traders may not get much in this bearish trend.


